


Diwali is done. Across the country the houses that were meant to be finished before the festival have been finished, and the last boxes have been laid.
That makes this a good moment to look at what people actually bought this year. For much of India’s tile trade, Diwali is a working deadline: a job that starts in June is supposed to be walked on by the festival, and the selections recorded between one Diwali and the next are about as close as this trade gets to a full season of demand.
Two of those seasons are now on record, and they show something worth a closer look. Comparing the same showrooms in both years, like for like, recorded selections rose by about 80%. 800×1600 rose too – by 9%. And its share of everything selected fell from 9.3% to 5.6%.
It did not shrink. It fell behind. That is a harder problem than a decline, and a much quieter one.
Growing, and falling behind
| Size (mm) | Share, year to Diwali 2025 | Share, year to Diwali 2026 | Change in selections |
|---|---|---|---|
| 600×1200 | 53.2% | 56.4% | +90% |
| 600×600 | 9.8% | 9.3% | +71% |
| 1200×1800 | 8.8% | 8.0% | +62% |
| 800×1600 | 9.3% | 5.6% | +9% |
| 1200×2400 | 6.3% | 5.1% | +46% |
| 300×600 | 2.7% | 3.6% | +139% |
| 200×1200 | 3.2% | 2.7% | +51% |
Share of recorded selections by size, and change in the number of selections, over equal 365-day periods ending at each Diwali, across the same showrooms in both years. Source: CeramicPost analysis of dealer order records.
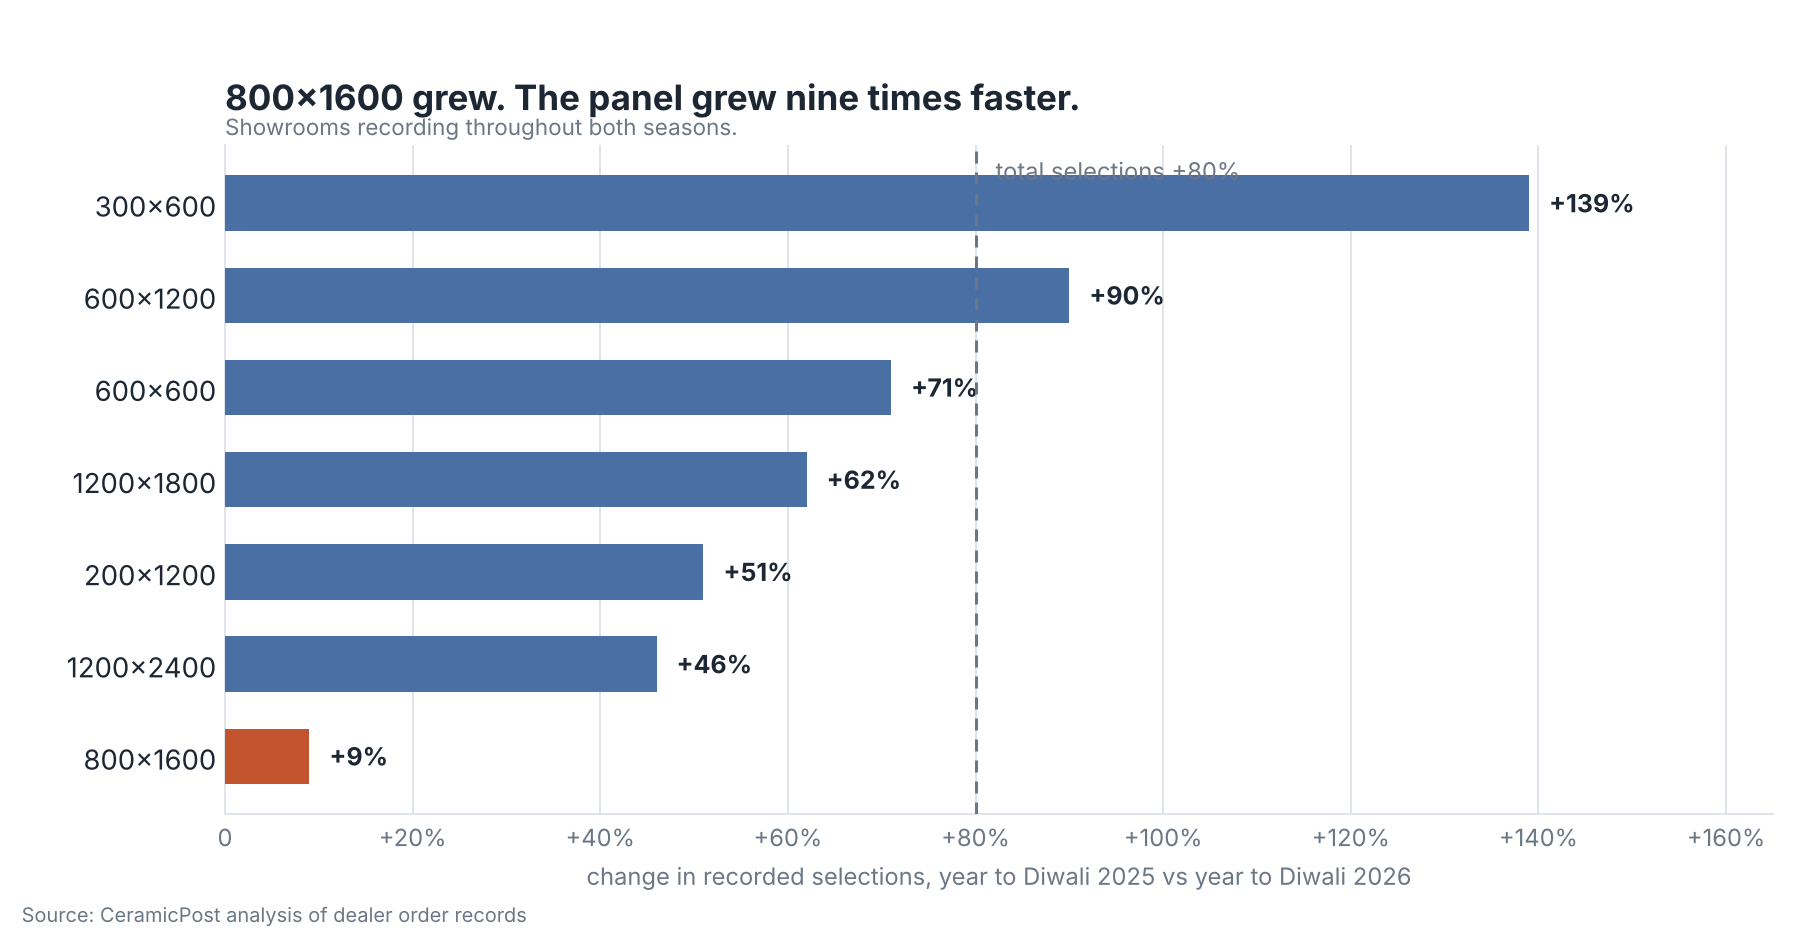
Every size in that table grew. The question is by how much. 600×1200 grew 90%, 600×600 grew 71%, 1200×1800 grew 62%. 800×1600 grew 9%, against an 80% rise in total recorded selections. Next to the others, it barely moved.
A manufacturer looking at despatch figures for 800×1600 would see a number going up and decide nothing was wrong. Nothing is wrong with the number. But its share of what gets selected has fallen by about two fifths, while other sizes have grown many times faster.
Two things make this hard to put down to which showrooms we happened to look at. Its share fell in every showroom in the comparison, from Mumbai and Chennai to Jaipur, Chandigarh and Raipur, with no exceptions – by 1.0 percentage points at the smallest and 9.8 at the largest. And the fall comes from showrooms picking it less often, not from busier showrooms crowding out quieter ones.
This is not a move away from large format
The obvious explanation would be that buyers have gone off big tile and come back to something a mason can handle more easily. The selections say otherwise.
1200×1800, a much bigger tile, grew 62%. 1200×2400 grew 46%. Put together, sizes of 1200×1800 and above grew 64% in recorded selections, and their combined share only slipped from 15.6% to 14.3%. At the other end, 600×600 grew 71% and 300×600 more than doubled.
So these showrooms did not turn against big tile. Nearly everything grew, and one size got left behind.
800×1600 is also not the only size losing ground, and it would be wrong to say it is. 800×2600 fell 61% in selections, and from 2.4% of the panel to 0.5%. 1200×1200 fell 60%. Both are smaller stories, but they belong in the picture.
800×2600 is worth a second look, because it is less a size dying than a height changing. 800×2400 went from almost nothing to 2.2% of selections over the same period, and the tall slab sizes together – 800×2400, 800×2600 and 800×3000 – more than doubled. The records point to a move toward 800×2400 while 800×2600 lost ground. Nothing like that happened with 800×1600.
This is not a case of 800×1600 disappearing from the counter either. The number of different product codes showing up in 800×1600 selections more than quadrupled, from 279 to 1,202, while total selections for the size grew by only 9%. On average, each code is now picked about three quarters less often than it was.
More codes are turning up in the records, and they are not bringing matching growth in selections with them. Whatever is behind that – new ranges, more showrooms carrying them, or simply better record keeping – each code is now doing a fraction of the work it did a year ago. That is a question for anyone planning a catalogue.
When we looked at who was actually buying 800×1600, demand was narrower than the marketing suggested. The year since suggests it still has not widened.
Where it is losing ground, and where it still works
| Room | Year to Diwali 2025 | Year to Diwali 2026 | Change |
|---|---|---|---|
| Bathroom | 7.8% | 3.0% | -4.8 pp |
| Drawing room | 14.6% | 13.0% | -1.6 pp |
| Lobby | 12.6% | 11.2% | -1.4 pp |
| Kitchen | 2.3% | 1.3% | -1.0 pp |
| Outdoor | 1.4% | 0.6% | -0.8 pp |
| Balcony | 0.8% | 0.4% | -0.4 pp |
| Bedroom | 7.5% | 11.1% | +3.6 pp |
| Other spaces | 12.6% | 8.7% | -3.9 pp |
800×1600 as a share of recorded selections for each room. “Other spaces” is a catch-all category rather than a room. Source: CeramicPost analysis of dealer order records.
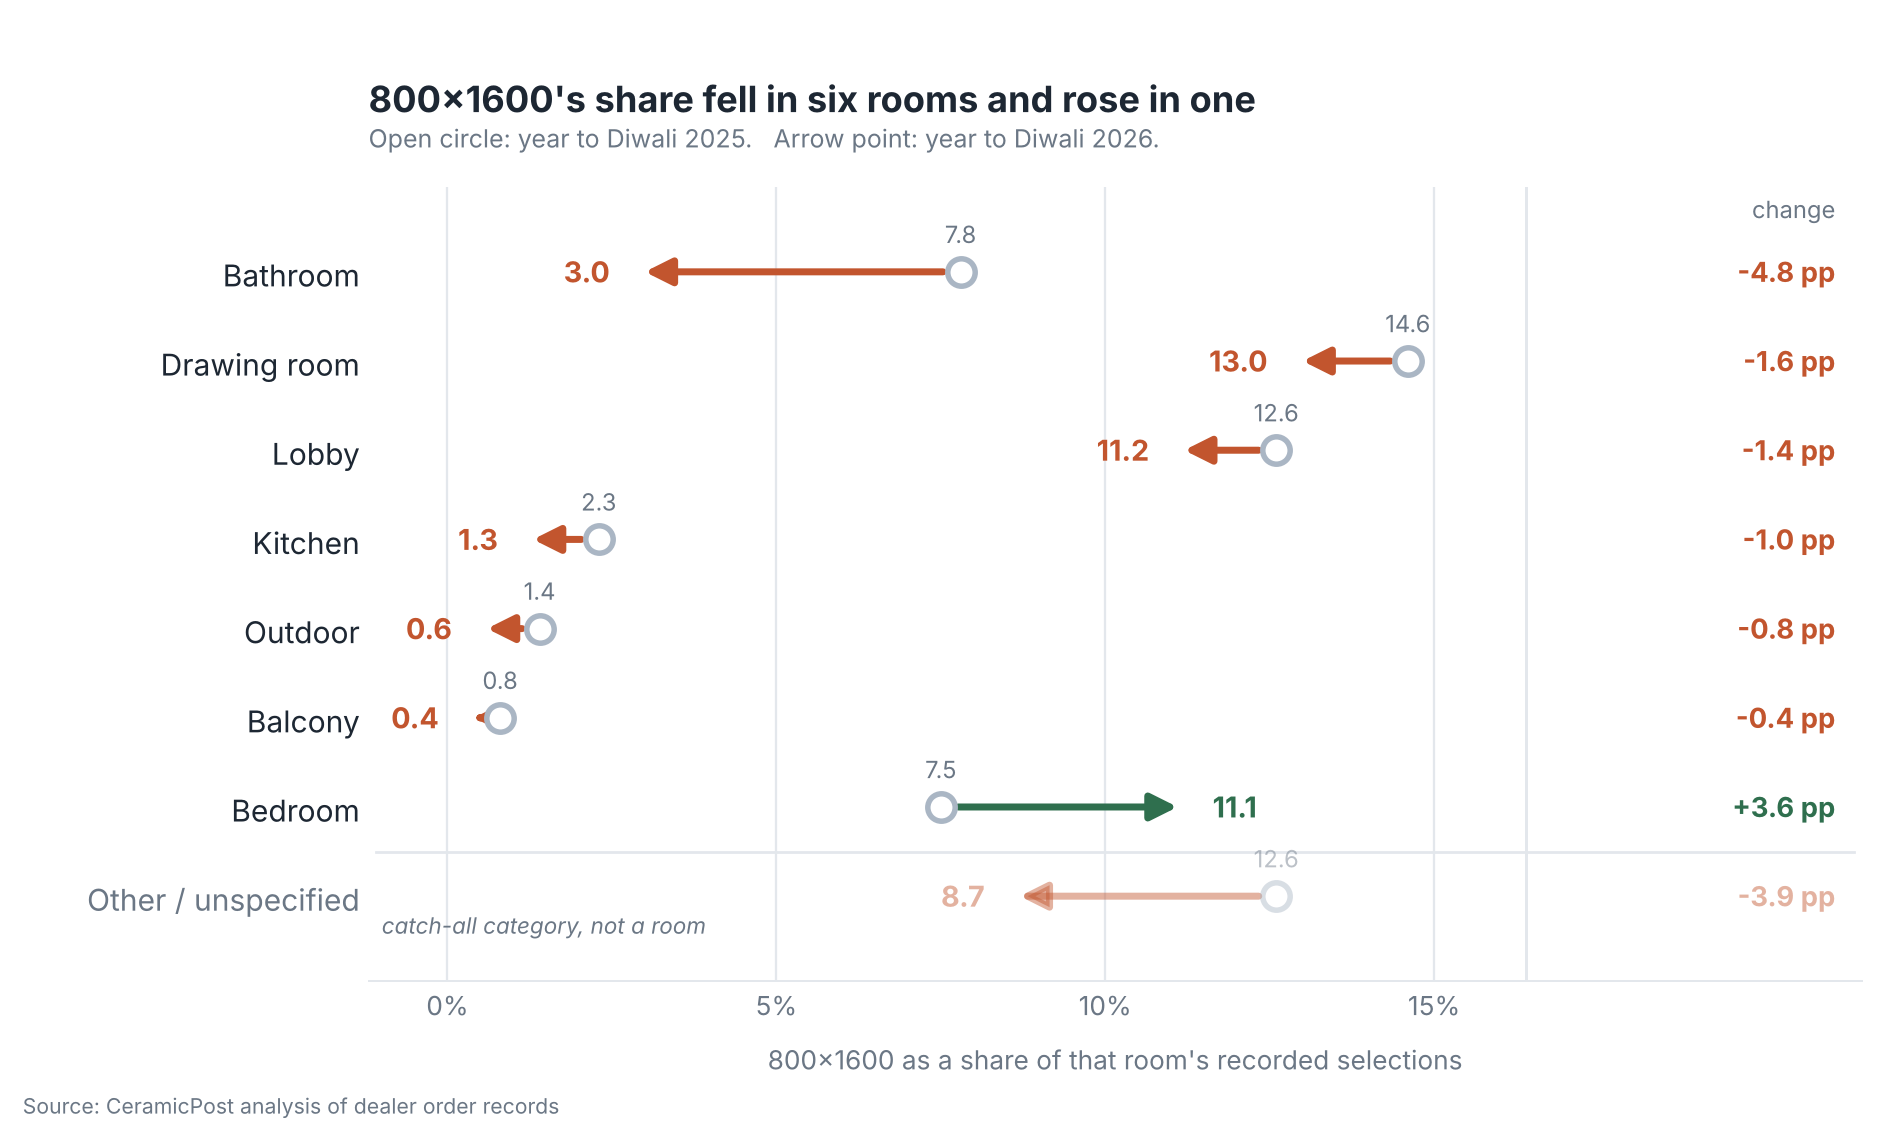
The biggest loss is in bathrooms, with the catch-all “other spaces” category close behind. Kitchens have moved away from it too, though from a low starting point – there, 600×1200 and the tall 800×2400 slabs now take 39% and 25% of selections.
It holds up best in the bigger, more open rooms. It is still the third most selected size in drawing rooms at 13.0%, behind 600×1200 at 41% and 1200×1800 at 27%, and it holds 11.2% in lobbies. The obvious reading is that a large tile looks its best across an open floor, though the records only show what happened, not why.
And in bedrooms it gained, from 7.5% to 11.1% – the one room moving the other way, and now third behind 600×1200 and 200×1200.
That looks less like a product failing and more like one narrowing down. 800×1600 is behaving less like an all-purpose large format and more like a drawing room, lobby and bedroom size. That is a narrower product than the one many dealers were sold, and it changes the choice between display space and stock rather than settling it.
Regional preferences differ
| Market | 600×1200 | 600×600 | 1200×1800 | 800×1600 |
|---|---|---|---|---|
| Tamil Nadu | 65.2% | 8.9% | 6.5% | 5.9% |
| Telangana | 59.6% | 10.1% | 13.2% | 4.5% |
| Chhattisgarh | 58.7% | 6.3% | 7.2% | 8.5% |
| Chandigarh | 52.7% | 10.3% | 9.1% | 9.9% |
| Maharashtra | 51.7% | 7.9% | 8.6% | 4.5% |
| Rajasthan | 50.4% | 19.3% | 4.6% | 10.0% |
Share of recorded selections by size, year to Diwali 2026. These are the figures for the showrooms taking part in each market, not estimates for the state as a whole. Source: CeramicPost analysis of dealer order records.
Rajasthan picks 600×600 at roughly twice the rate of the panel as a whole, and 1200×1800 at half of it. Of the markets here, Telangana has the highest 1200×1800 share at 13.2%. And 800×1600 is still close to 10% in Rajasthan and Chandigarh, and above 8% in Chhattisgarh – in Rajasthan and Chandigarh, more than twice the Maharashtra level.
The number of showrooms taking part is different in each market, so these are not surveys of those states. But the spread is wide enough to be worth a sales manager’s time: whatever is happening to 800×1600 has not happened evenly, and a national size chart would be wrong in both directions depending on the territory.
About this data
These figures come from dealer order records generated through Concord Sales360, a tile & ceramic showroom software run by Concord Technosoft. The wider dataset covers showrooms in twenty cities, from Jammu and Ludhiana to Chennai and Thiruvananthapuram.
The comparison uses two equal 365-day periods ending at Diwali 2025 and Diwali 2026, and the same group of showrooms, busy in both. Showrooms with too little activity, or that stopped recording before the second period ended, are left out, because either one would turn a gap in the records into something that looks like a trend.
A couple of those showrooms began recording partway through the earlier period. Because their records do not cover the full year, they can affect both the growth figures and the size mix – the months that are missing may have had a different mix. So we also checked the result against a tighter group of showrooms with full records in both periods. The fall in 800×1600’s share held up, from 9.1% to 5.5%.
Size entries were cleaned up to one standard set of dimensions before counting, so that different ways of writing the same tile are grouped together – 119×240 with 120×240, 60×119 with 60×120, and values typed in millimetres into a field expecting centimetres. This matters: counting only the most common spelling of a size understates it by one to two percentage points. About 0.5% of records could not be matched to a standard size and are left out, and every figure here, including the growth in total selections, is worked out on the matched records only, so that all the numbers share the same base.
Product code counts are the number of different product codes, blanks excluded, appearing in selections of that size, using the same rule in both periods. A code can appear against more than one size, so these are codes seen in 800×1600 selections rather than codes used only for that size.
An order is recorded room by room, so the percentages are shares of recorded selections rather than of whole orders, and one customer can account for several selections. These are selections taken down at the counter, not invoices or despatches that we can check independently. We also looked showroom by showroom, to separate a change in what customers are picking from a change in which showrooms are busiest.
This is a group of dealers rather than a survey of the whole trade, and it leans toward the markets these showrooms sell in. It is evidence of what is being recorded at the counter, not a measurement of the Indian tile market.
What to do with it
If you make 800×1600, the despatch figure on its own is not telling you what the counter is telling you. A size growing at about a ninth of the rate of everything else in this panel is losing ground even while the number on the report goes up. More product codes are showing up in the records, and selections have not grown anywhere near as fast. The question is no longer how many codes to add. It is which rooms the size is actually winning, and whether the range matches that.
If you sell it, the question is not whether to carry it. It is whether it still earns a place on the main floor, or whether it has become what the selections suggest: a size that is strongest in drawing rooms, lobbies and bedrooms, rather than an all-purpose large format. That is a different proposition for display space and stock.
