


In September we set a test. India’s tile exporters had let volume collapse rather than cut prices, and the question was whether the higher price would survive once the fuel shock eased. The benchmark was stated plainly: if dollar realisation steadied above the prior-year level while volume recovered, the repricing had partly stuck. If it slid back, it was a squeeze that passed.
August has published, and the answer is that it held. Dollar realisation came in at $4.33 per square metre against $3.84 a year earlier. Volume was flat for the third month running.
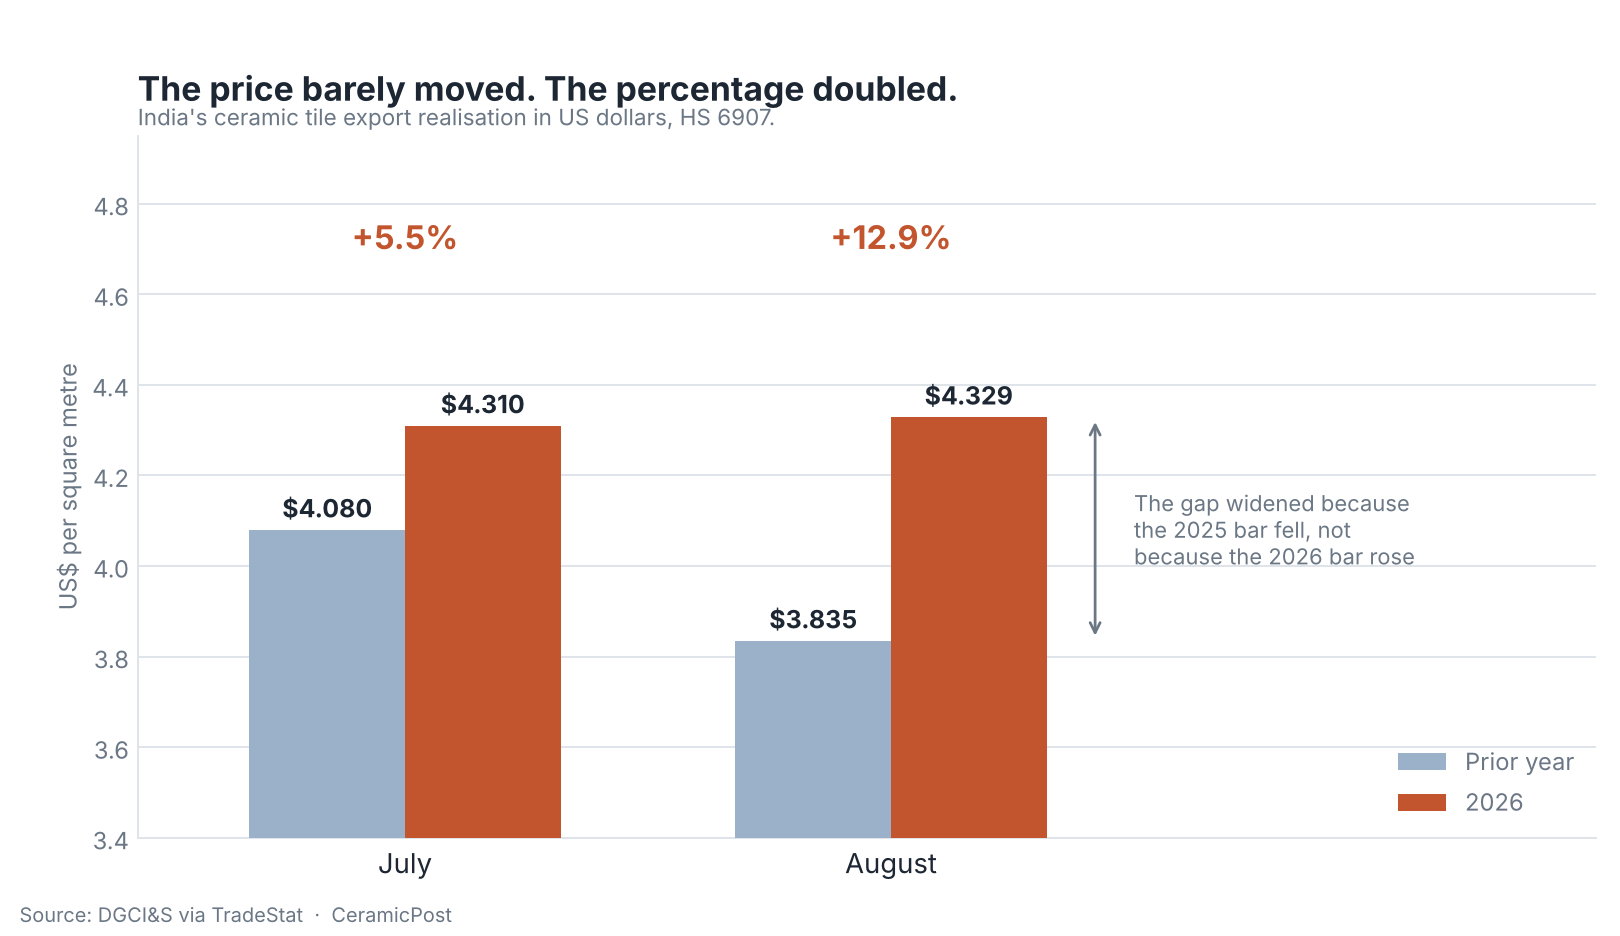
But the answer arrives wrapped in two numbers that both make it look like something it is not. The rupee figure says export realisation rose 23.1% in August. The dollar figure says 12.9%. July’s equivalents were 17.5% and 5.5%. Read either pair straight and you would conclude that Indian tile got sharply dearer in August, and that the premium is widening again.
Nothing of the sort happened. Dollar realisation moved from $4.310 to $4.329 between July and August – a change of four-tenths of one per cent. The entire apparent acceleration is the comparison base falling away.
What August actually shows
| Aug 2025 | Aug 2026 | Change | |
|---|---|---|---|
| Value, rupees | ₹1,618 cr | ₹1,279 cr | -20.9% |
| Value, dollars | $184.8 mn | $134.0 mn | -27.5% |
| Volume | 48.2 msm | 30.9 msm | -35.8% |
| Realisation, rupees | ₹336/sqm | ₹413/sqm | +23.1% |
| Realisation, dollars | $3.835/sqm | $4.329/sqm | +12.9% |
India’s ceramic tile exports, HS 6907, August 2026 against August 2025. msm = million square metres. Source: DGCI&S via TradeStat.
Across the five months of the financial year so far, exports are down 31.2% in rupees and 37.9% in dollars, on volume down 44.2%. Rupee realisation for the period is ₹418 per square metre against ₹339; in dollars, $4.39 against $3.94.
One thing has to be restated before any of it is read as pricing. Realisation is value divided by volume. It is an average, not a price index. It rises when prices rise, and it also rises when the mix of what ships moves toward higher-value product. The full argument for why the evidence still points at repricing is set out in our analysis of how exporters held price and lost half their volume, and this piece does not re-run it.
Why both headline numbers overstate it
August 2025 was a weak month for realisation. It came in at ₹336 per square metre, or $3.835 – below July 2025’s ₹351 and $4.08, and near the bottom of the range realisation held through that year.
So when August 2026 is set against it, the gap looks dramatic. It is not that August 2026 was strong. It is that August 2025 was soft, and July 2025 was the high point of the old regime. Compare the same month of 2026 against two different 2025 baselines and you get two very different percentages out of one unchanged price.
This is the same trap the September analysis flagged, one level deeper. There the warning was that the rupee number misleads, because a weakening currency holds it up while the real price falls. That is still true: the implied exchange rate moved from ₹87.52 to ₹95.47 to the dollar over the year, a depreciation of 9.1%, which is almost exactly the gap between the 23.1% rupee figure and the 12.9% dollar one.
August adds a second warning. Converting to dollars removes the currency distortion but not the base distortion. A year-on-year percentage compares two points, and it moves when either one does. If the question is whether a price has changed recently, a year-on-year figure is the wrong instrument whichever currency it is denominated in.
The level is the measure
Set the percentages aside and look at what a square metre of Indian tile actually earned, month by month, in the currency the buyer pays in.
| Period | Dollar realisation | Prior year | Change |
|---|---|---|---|
| Q1 FY27 (Apr-Jun) | $4.450 | $3.930 | +13.2% |
| Apr-Jul | $4.405 | $3.967 | +11.0% |
| July alone | $4.310 | $4.080 | +5.5% |
| August alone | $4.329 | $3.835 | +12.9% |
| Apr-Aug | $4.387 | $3.940 | +11.3% |
Export realisation in US dollars per square metre. The percentage column swings between 5.5% and 13.2% while the level moves inside a range of about three per cent. Source: DGCI&S via TradeStat.
The left-hand column is the story. Dollar realisation ran $4.45 across the first quarter, eased to $4.31 by July, and sat at $4.33 in August. That is a decline of about three per cent across five months, and it stopped in August. The right-hand column swings from +13.2% to +5.5% and back to +12.9% over the same period, describing a volatility that did not occur.
Against the prior-year benchmarks the September piece named – $3.93 for the first quarter, $4.08 for July – August’s $4.33 sits comfortably above both. The premium did not unwind. It settled.
Volume stopped falling too, and the percentages hide that as well
The same arithmetic runs through the volume figures, in the opposite direction.
| Month | Volume FY27 | Volume FY26 | Change |
|---|---|---|---|
| June | 31.4 msm | 42.0 msm | -25.1% |
| July | 31.0 msm | 44.7 msm | -30.7% |
| August | 30.9 msm | 48.2 msm | -35.8% |
Monthly export volume. The year-on-year fall deepens by more than ten points while actual shipments barely move. Source: DGCI&S via TradeStat.
Read the change column alone and the collapse is accelerating. Read the first column and India has shipped almost exactly the same quantity of tile for three consecutive months. What deepened was last year’s comparison, which climbed from 42.0 to 48.2 million square metres across the same stretch.
That matters commercially, not just statistically. A business whose volume is stable at a lower level is in a different position from one still losing ground. The first can plan a firing schedule, hold a price and decide what to restart. The second cannot. The percentage says the second. The tonnage says the first.
What an exporter is actually holding
Put the two together and the shape of the year becomes clear. Volume found a floor around 31 million square metres a month in June and has stayed there. Dollar realisation found a floor around $4.31 to $4.33 in July and has stayed there. Neither is recovering. Neither is deteriorating.
That is a smaller export book, priced about eleven per cent above last year in the buyer’s currency, running flat. For an exporter the practical question is no longer whether the premium survives the next quarter. It is whether a plant can be run economically at a third less volume than last August, and for how long.
The cost side is where that gets decided, and it has moved. Gas prices that roughly doubled through the disruption have been easing, and the effect is visible at the domestic counter, where the gap between branded and Morbi prices narrowed as the cheaper side raised prices further than the branded side did. If input costs continue to fall while export realisation holds, the margin on what does ship improves without a single additional square metre leaving the country. That is a more comfortable position than the headline volume figure suggests, and it is not what a 35.8% fall reads like.
The half of the cluster that recovered
One comparison puts the tile numbers in proportion, and it has gone unremarked.
Sanitaryware exports – HS 6910, the other ceramic line out of the same cluster – fell 3.0% in value in August against the same month last year. Tiles fell 20.9%. In April both were collapsing together, sanitaryware down 27.5% and tiles down 65.6%. Since then sanitaryware has recovered in a straight line, month after month, while tiles went flat and stayed flat.
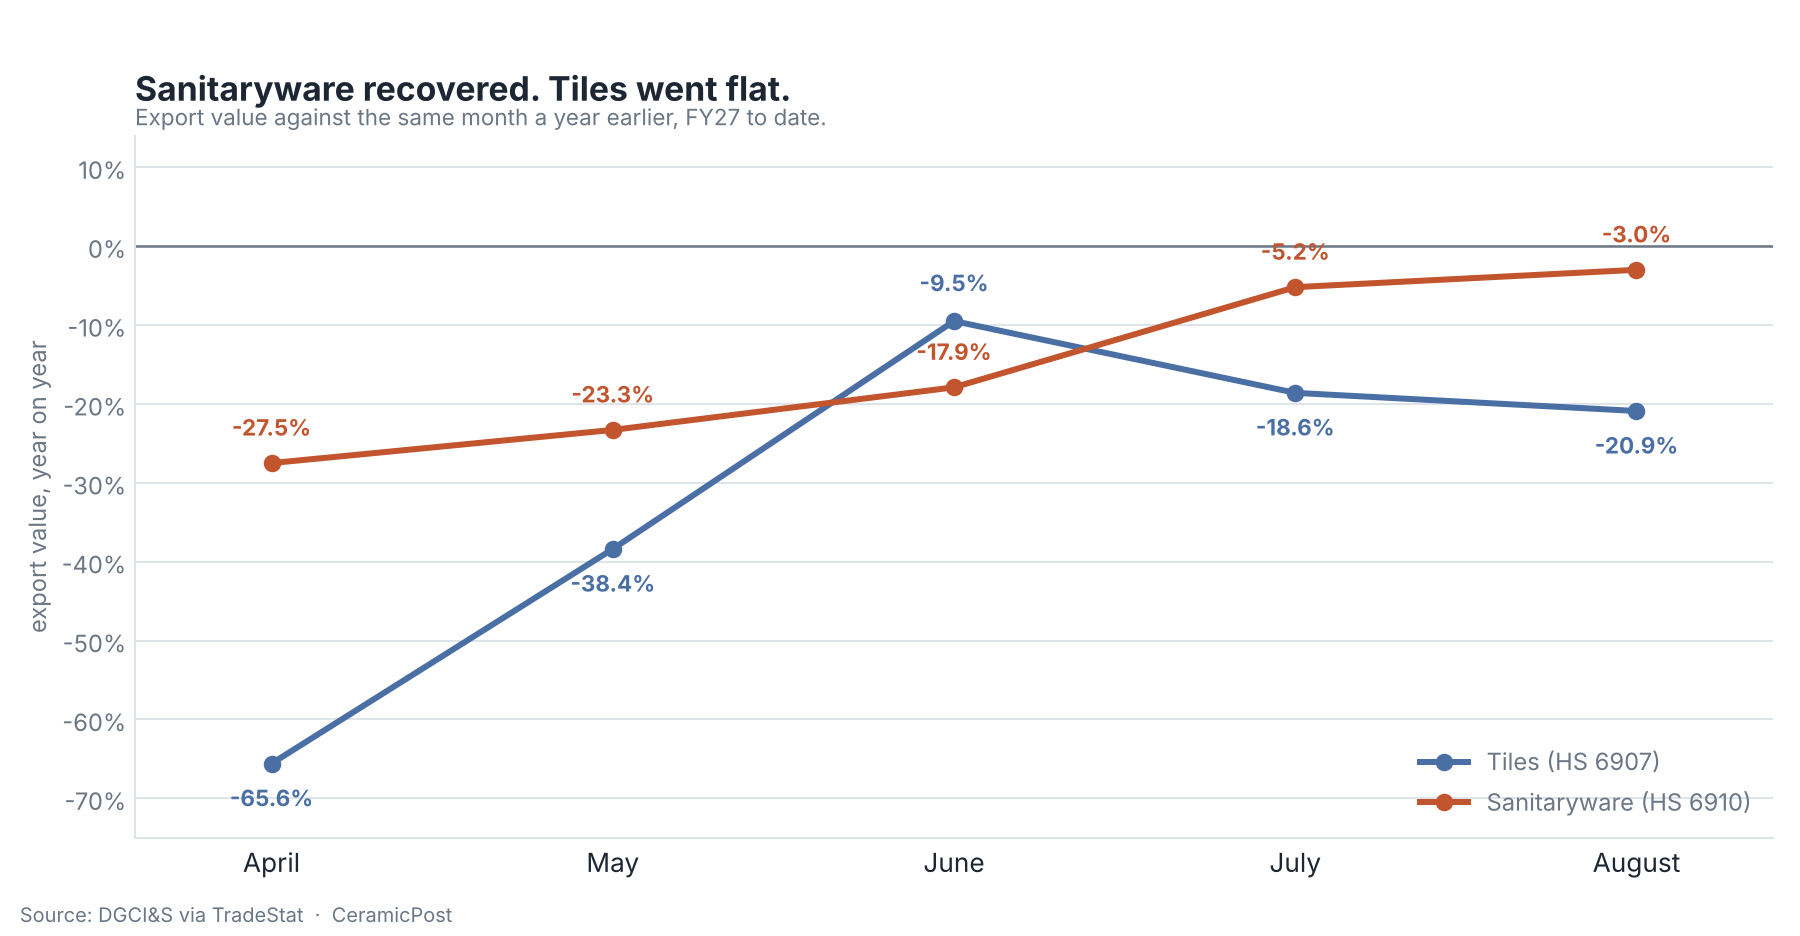
Same cluster, same gas bill, broadly the same destinations, opposite trajectories. We are not going to explain it here, because the trade data cannot: it shows what happened, not why. But it is the sharpest open question in India’s ceramic export book right now, and anyone arguing that the export problem is simply a cost problem has to account for why one product line recovered from it and the other did not.
What to watch next
The test the September piece set has been met, so the question changes. It is no longer whether the premium holds. It is whether the volume floor is a floor or a plateau on the way somewhere else.
Two things will say. If dollar realisation stays near $4.33 while volume starts climbing back toward 40 million square metres, Indian tile has genuinely moved up a tier abroad and is rebuilding the book at the new price. If volume recovers only as realisation slides back toward $3.90, the premium was a function of scarcity and is being traded away for throughput, order by order, the moment capacity comes back.
Watching this in rupees will not distinguish them, and as August shows, watching the year-on-year change will not either. The level, in dollars, month by month, is the only series that answers it. We publish it on our monthly export data page, updated as each month is released.
September’s figures should arrive in December. Against a prior-year base of ₹337 and 45.1 million square metres – another soft month – the year-on-year numbers will again look better than the underlying position. They should be read accordingly.
